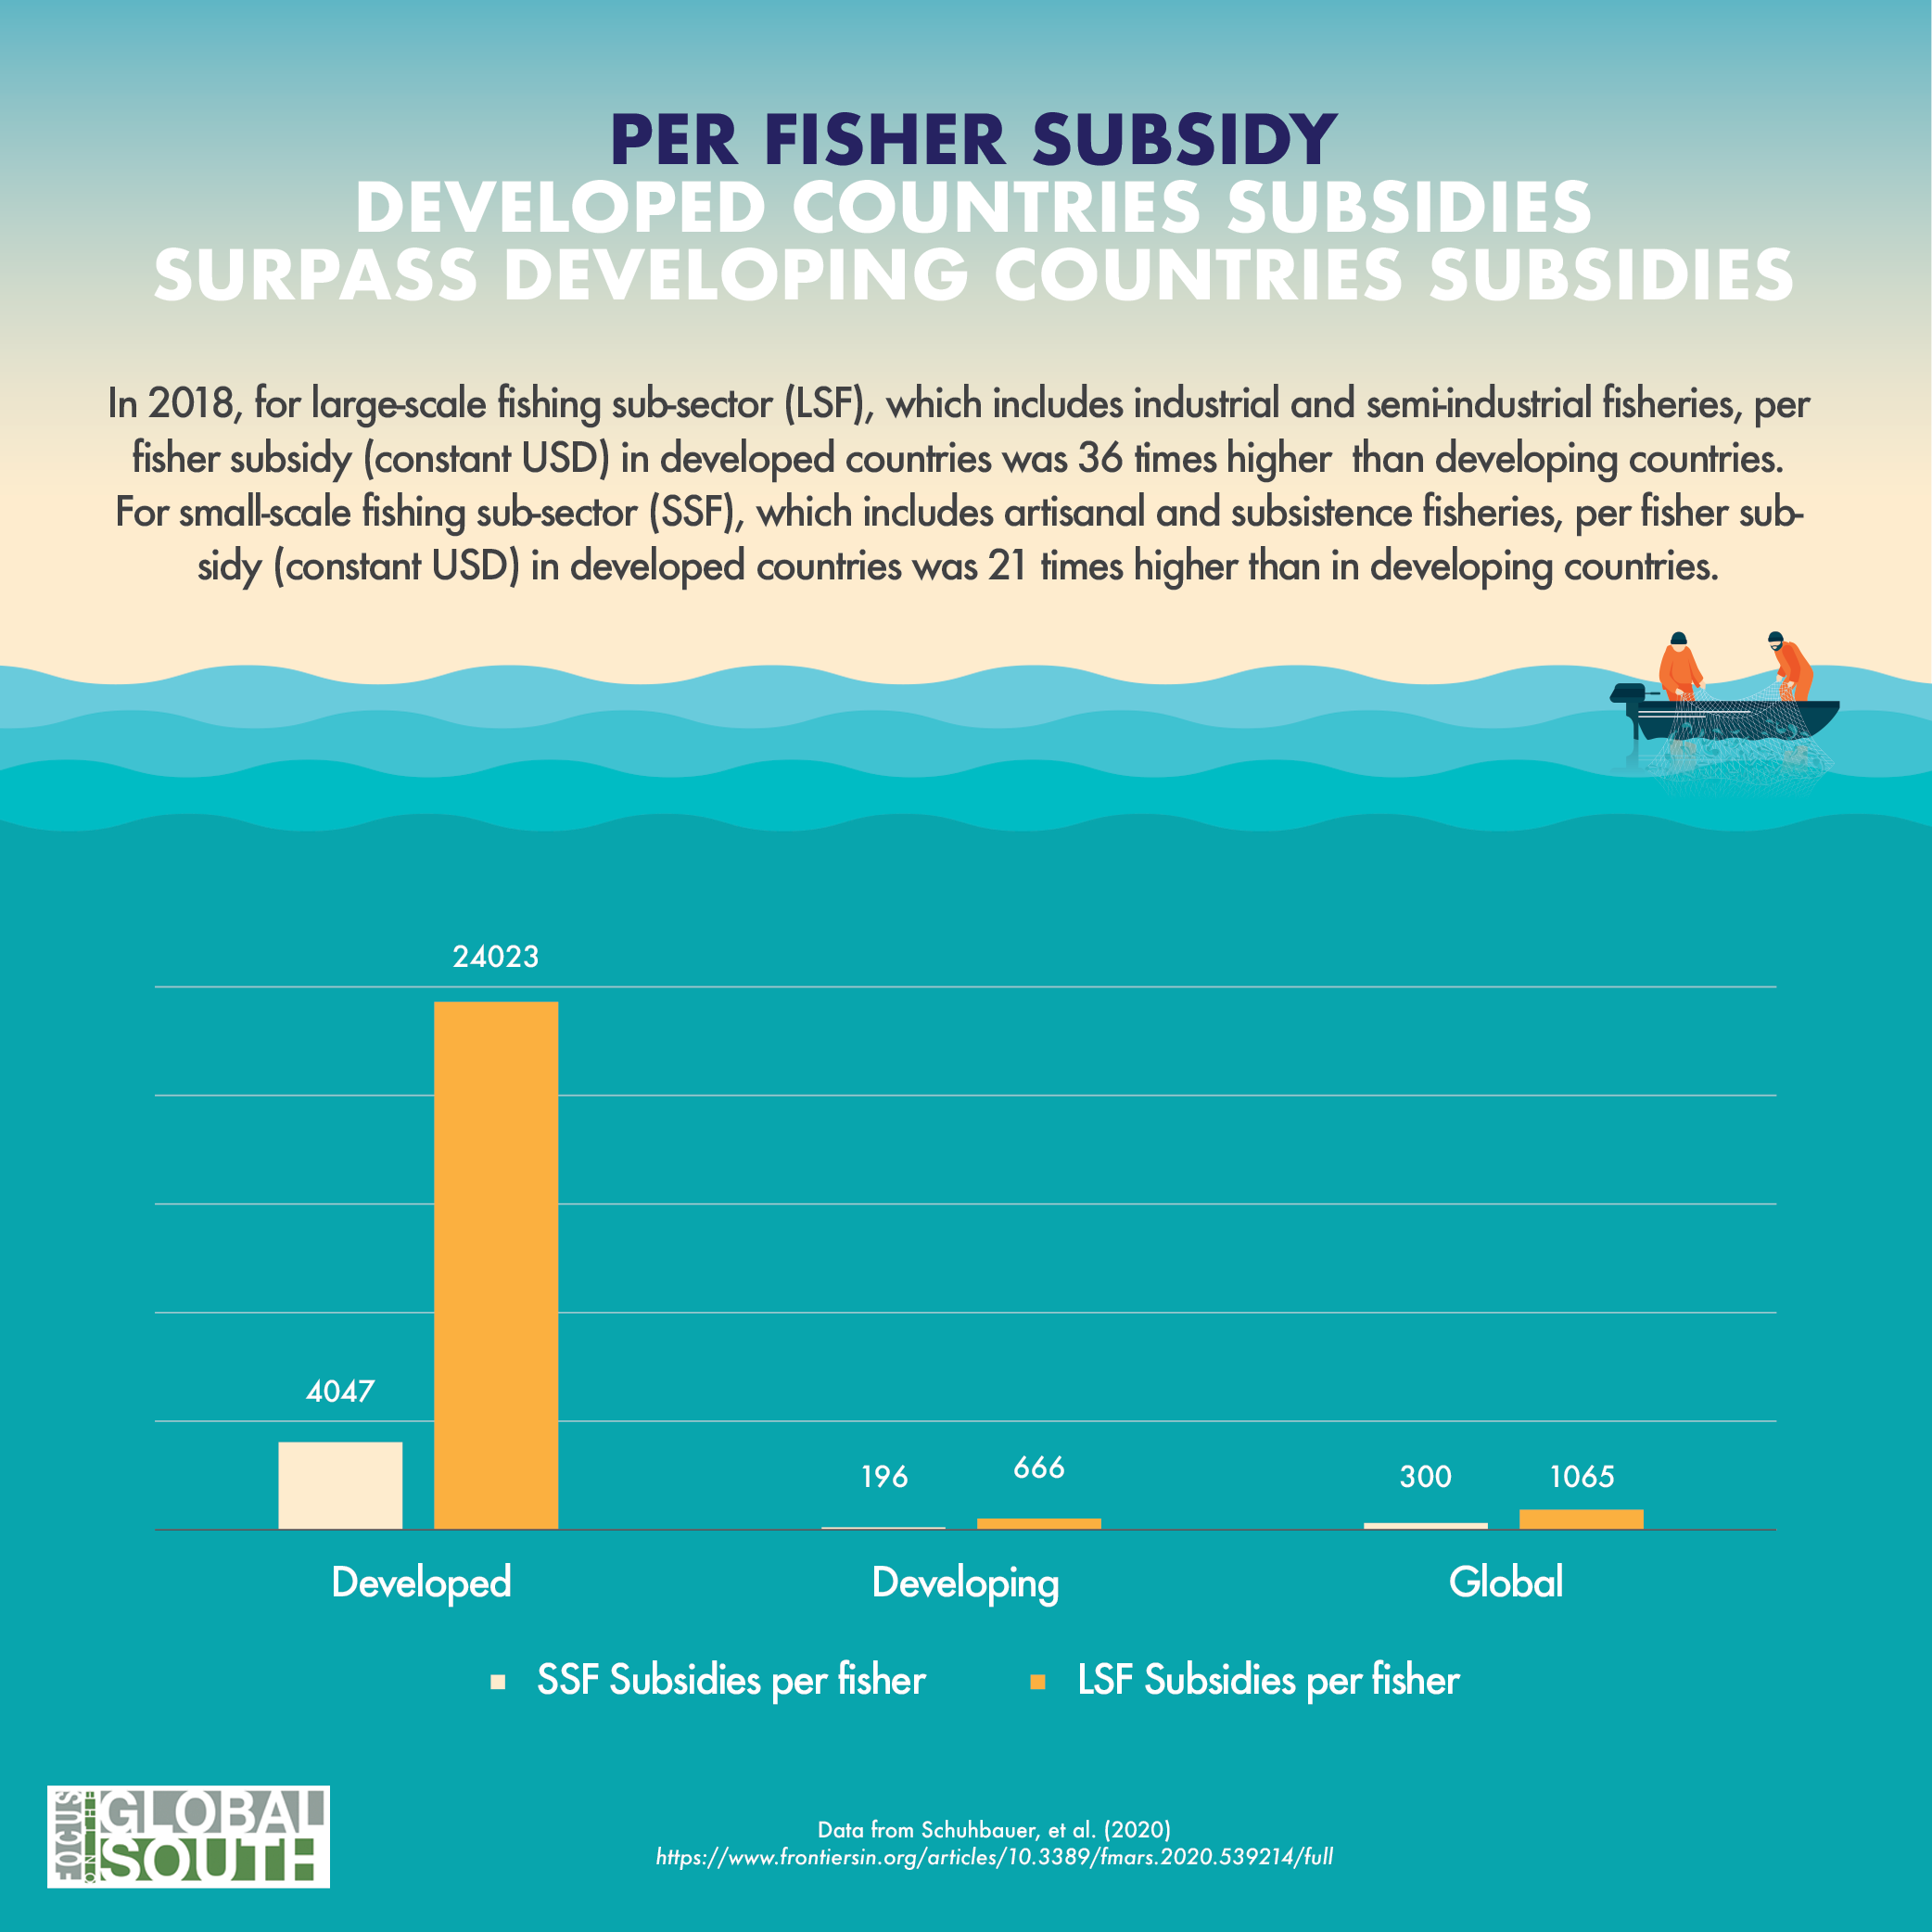
Infographic 1: Per Fisher Subsidy — Developed countries subsidies surpass developing countries subsidies
In 2018, for large-scale fishing sub-sector (LSF), which includes industrial and semi-industrial fisheries, per fisher subsidy (constant USD) in developed countries was 36 times higher than developing countries. For small-scale fishing sub-sector (SSF), which includes artisanal and subsistence fisheries, per fisher subsidy (constant USD) in developed countries was 21 times higher than in developing countries.
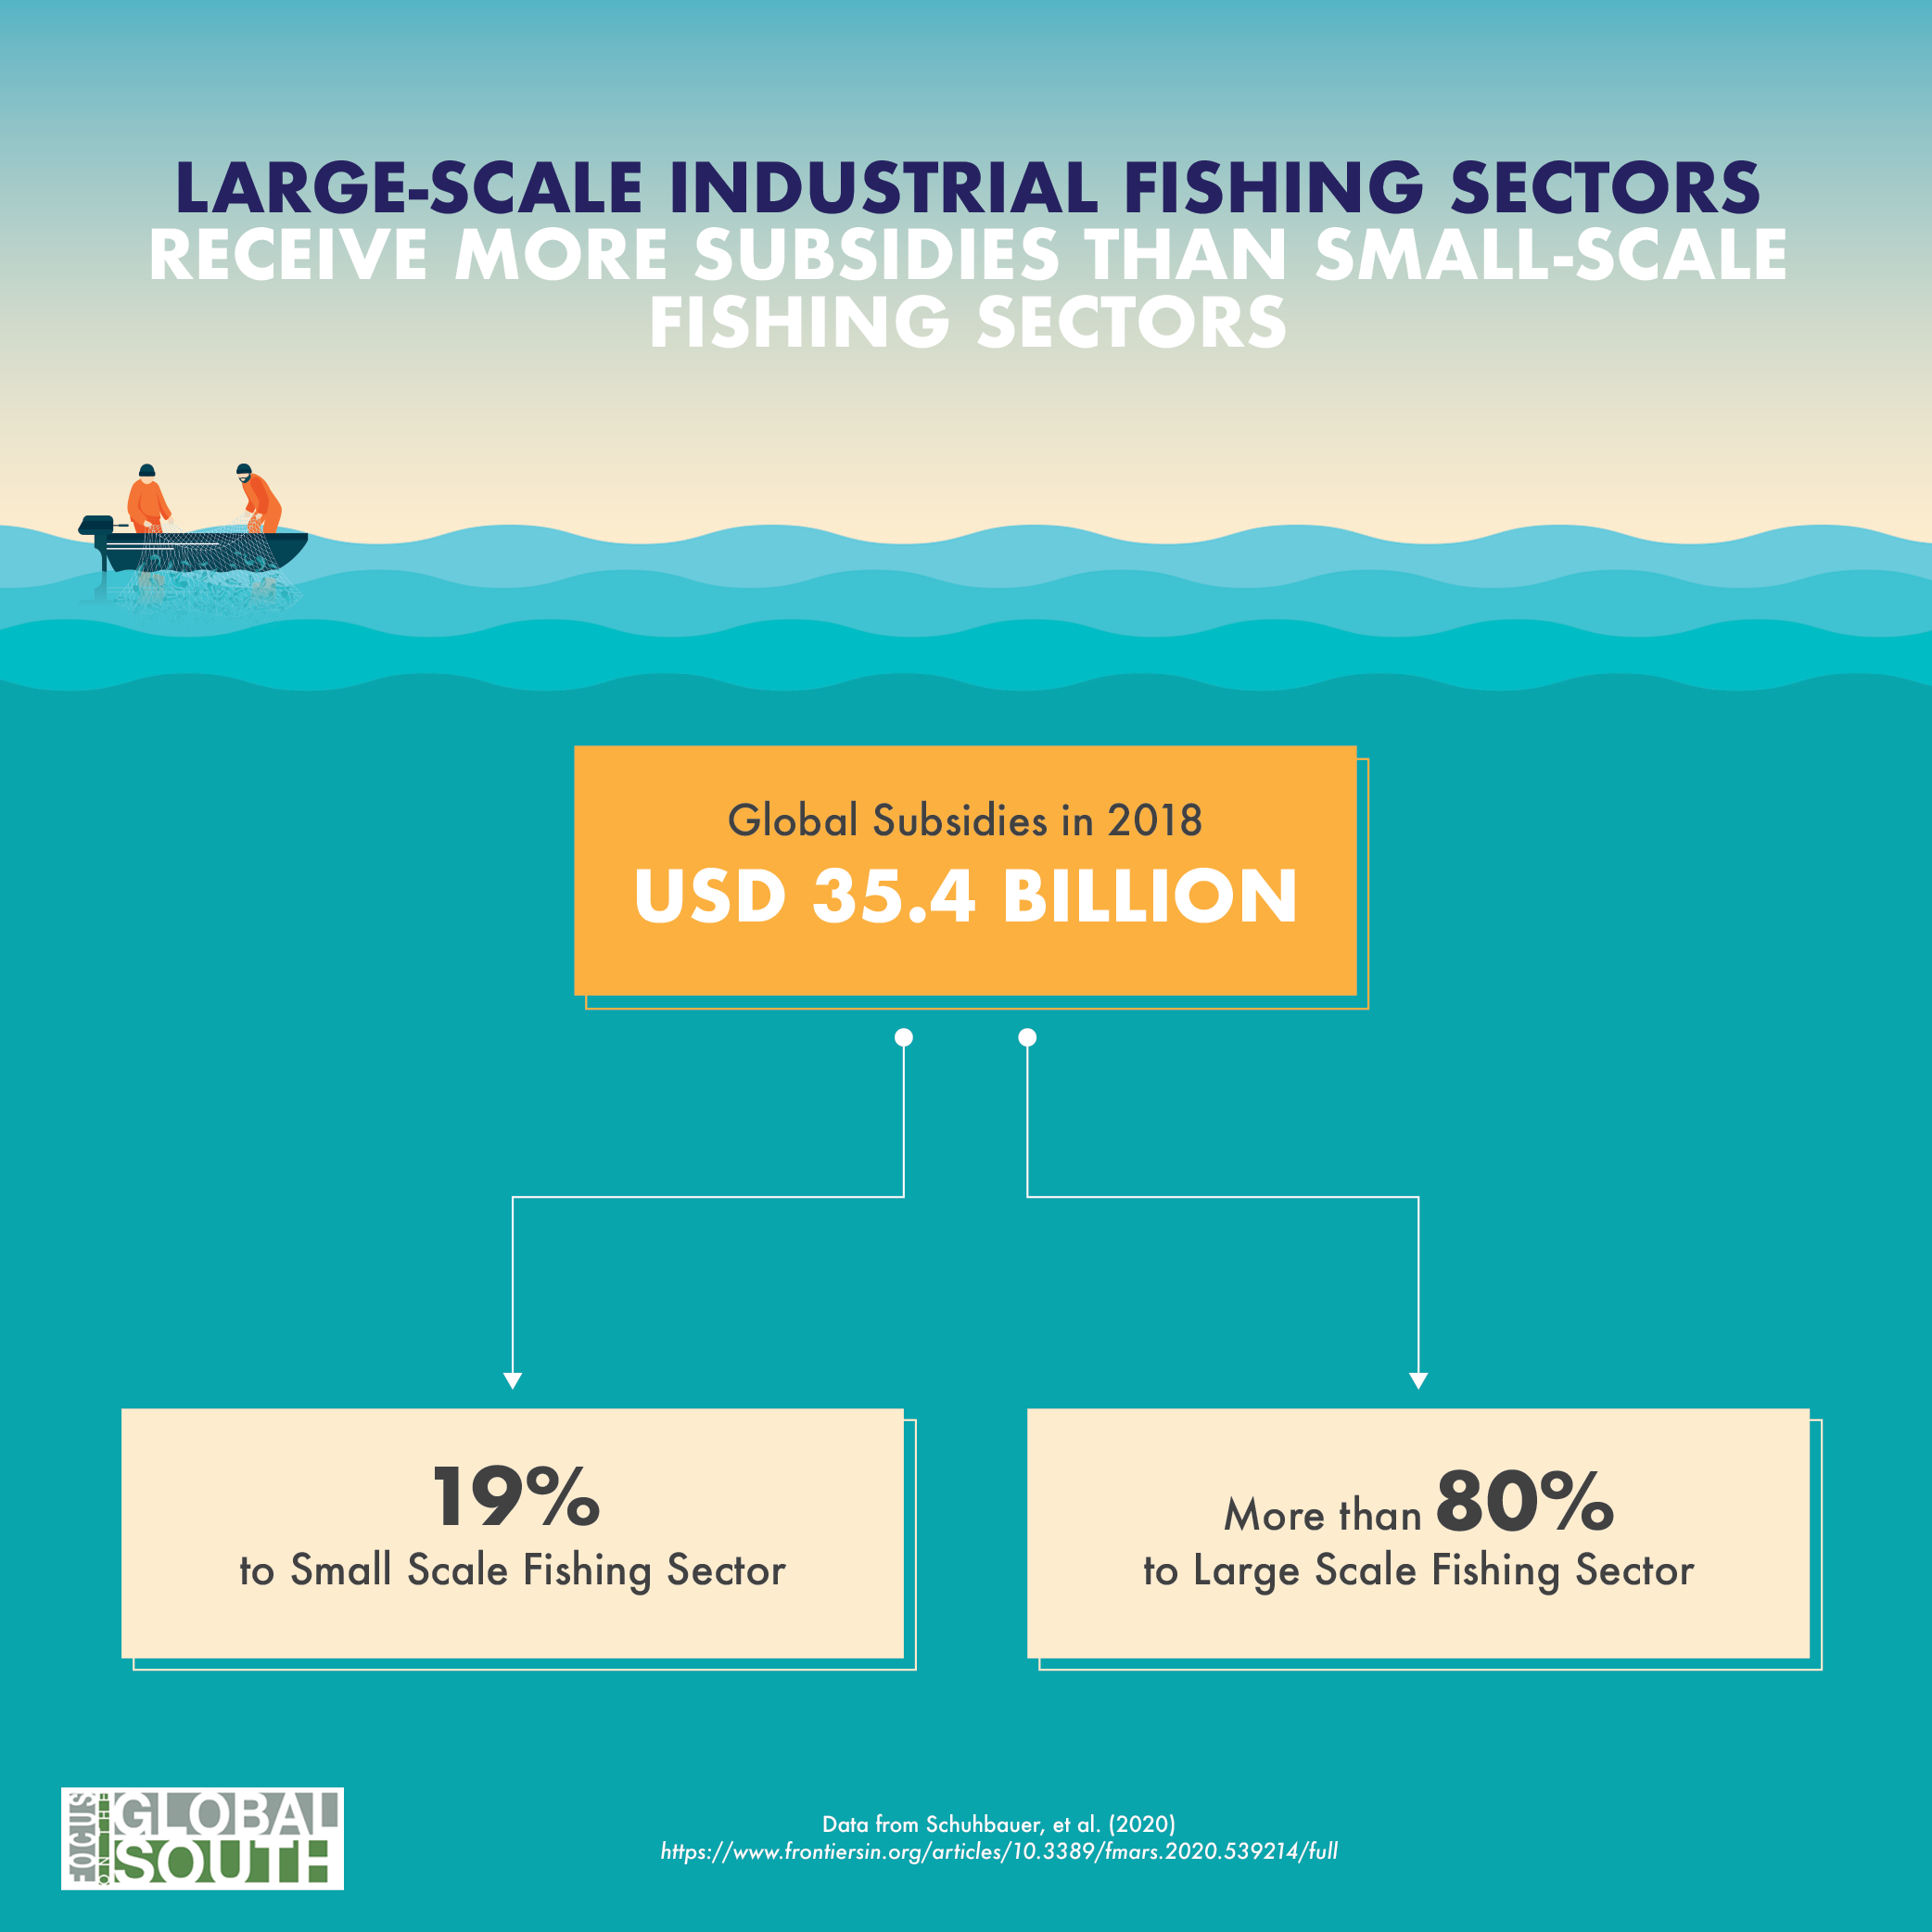
Infographic 2: Large-scale Industrial Fishing Sectors Receive More Subsidies than Small-scale Fishing Sectors
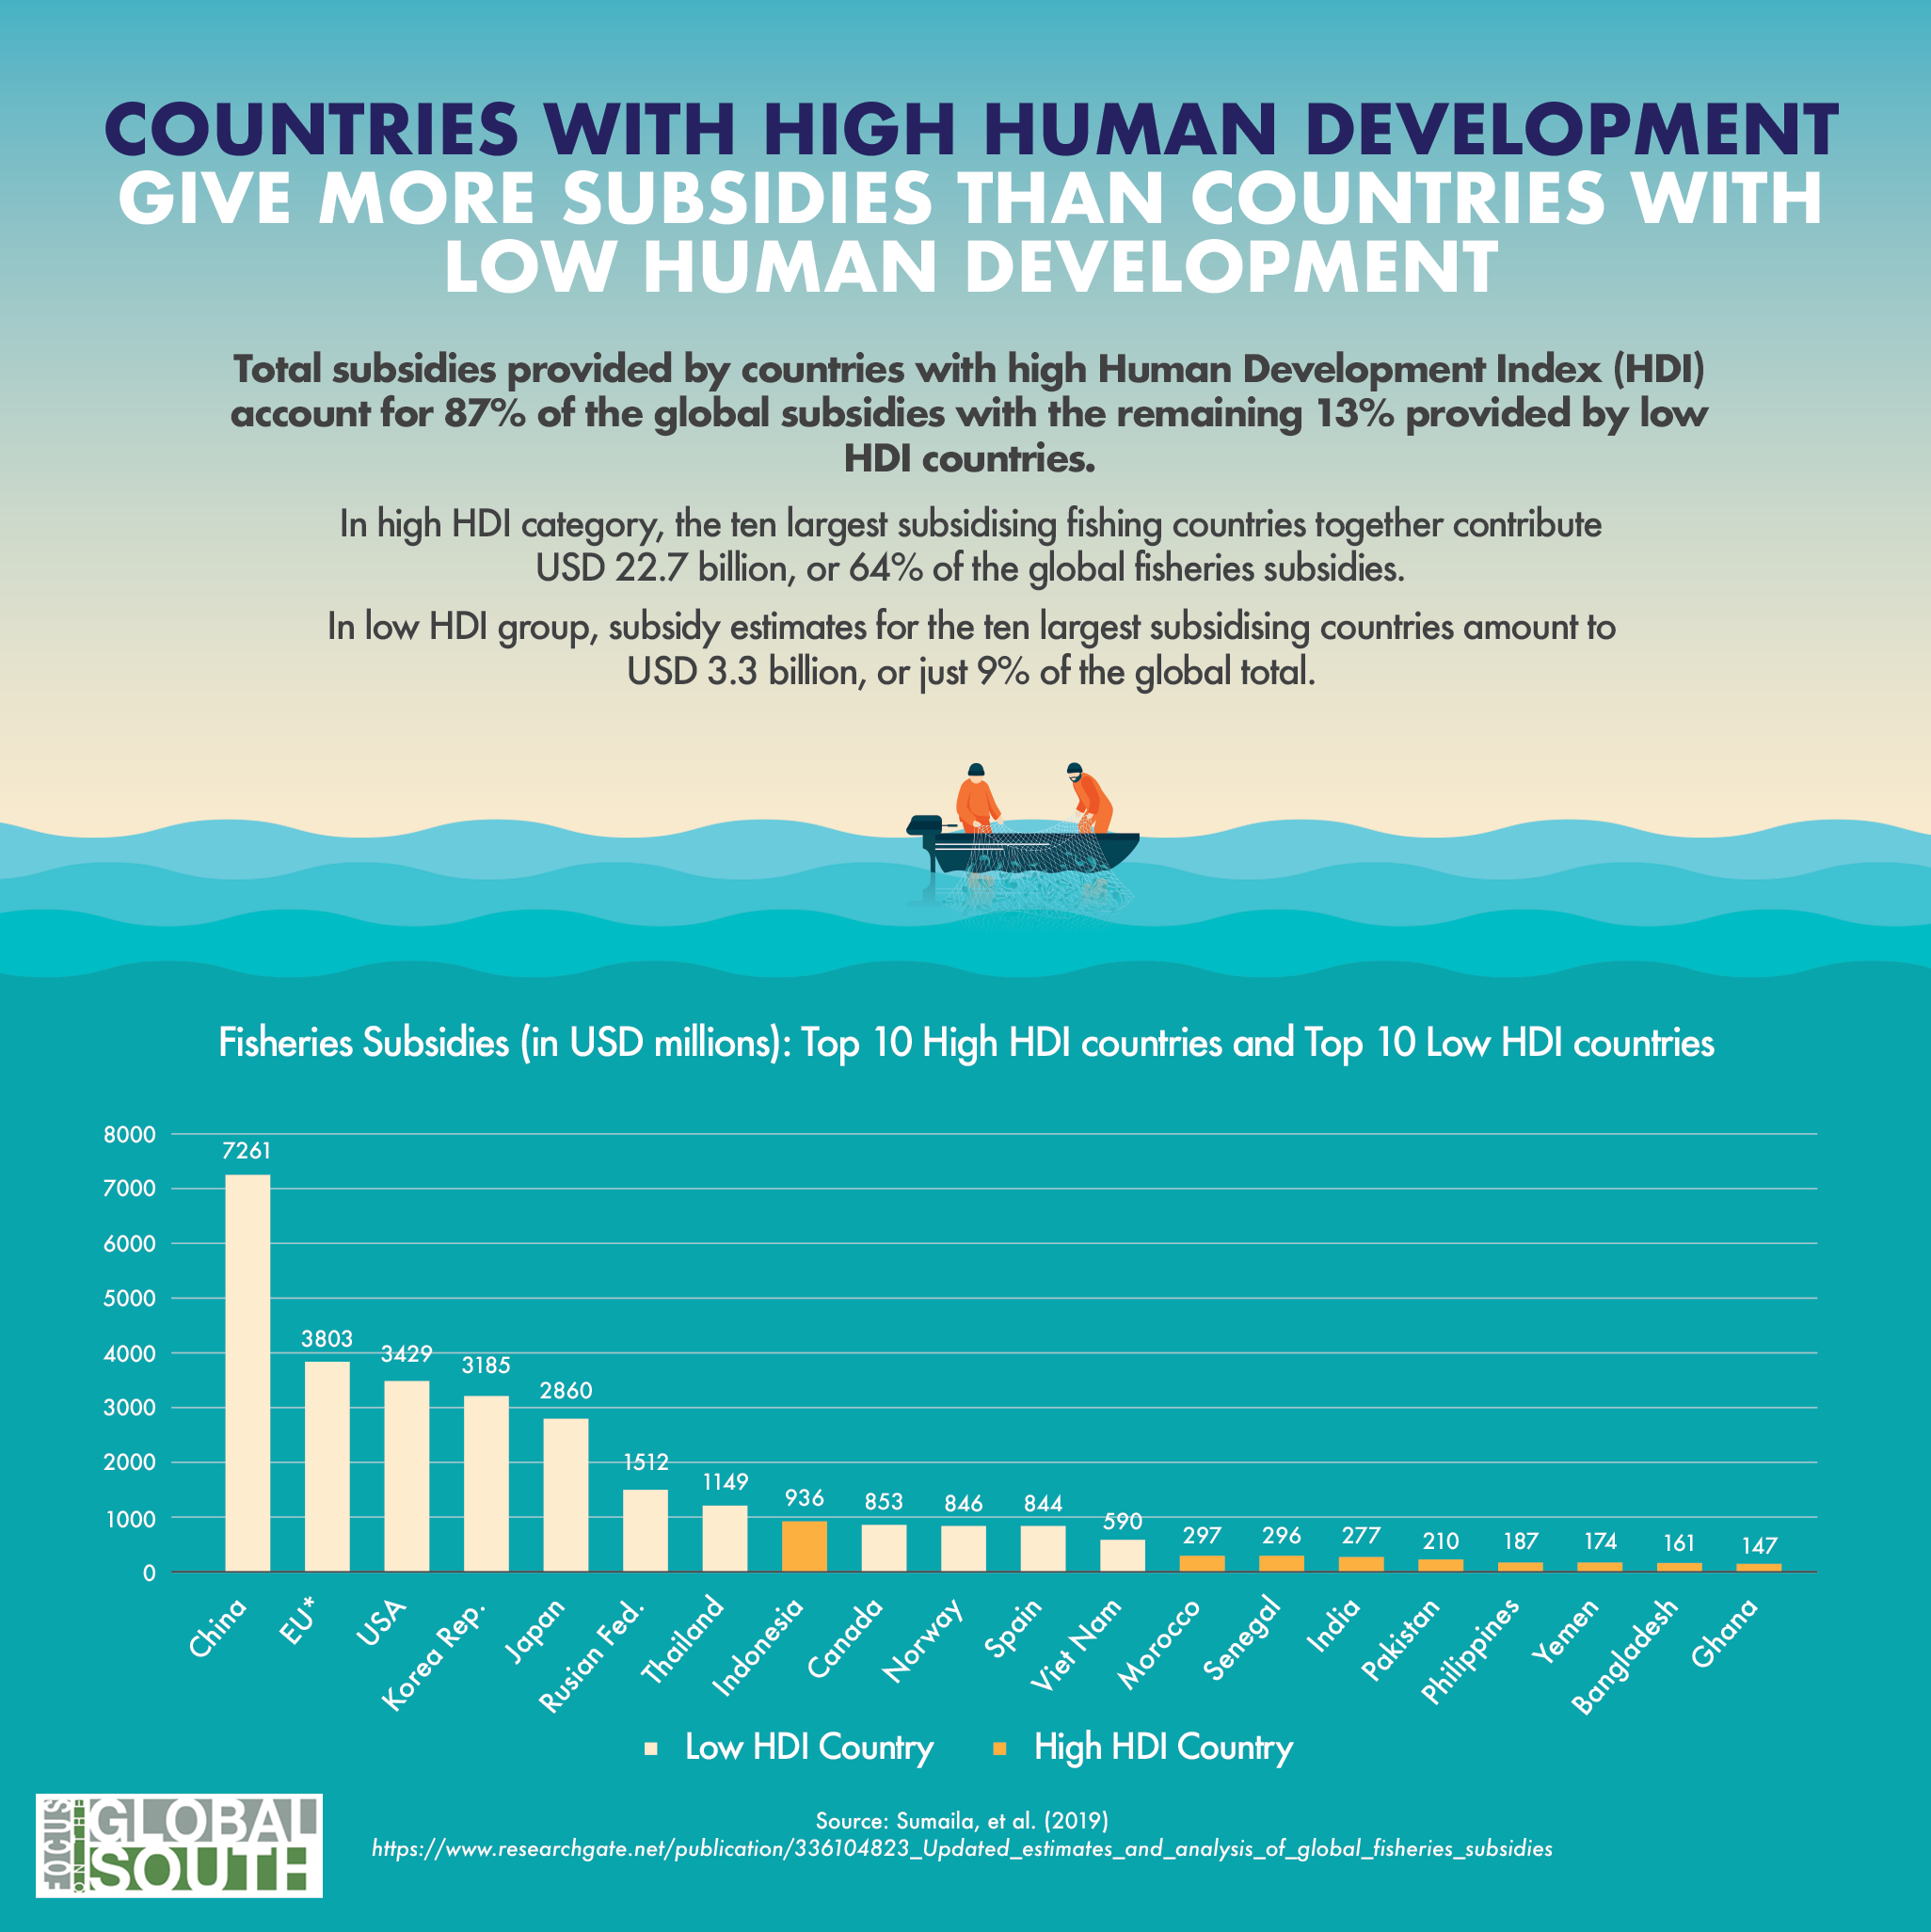
Infographic 3: Countries with High Human Development Give More Subsidies than Countries with Low Human Development
Total subsidies provided by countries with high Human Development Index (HDI) account for 87% of the global subsidies with the remaining 13% provided by low HDI countries.In high HDI category, the ten largest subsidising fishing countries together contribute USD 22.7 billion, or 64% of the global fisheries subsidies. In low HDI group, subsidy estimates for the ten largest subsidising countries amount to USD 3.3 billion, or just 9% of the global total.
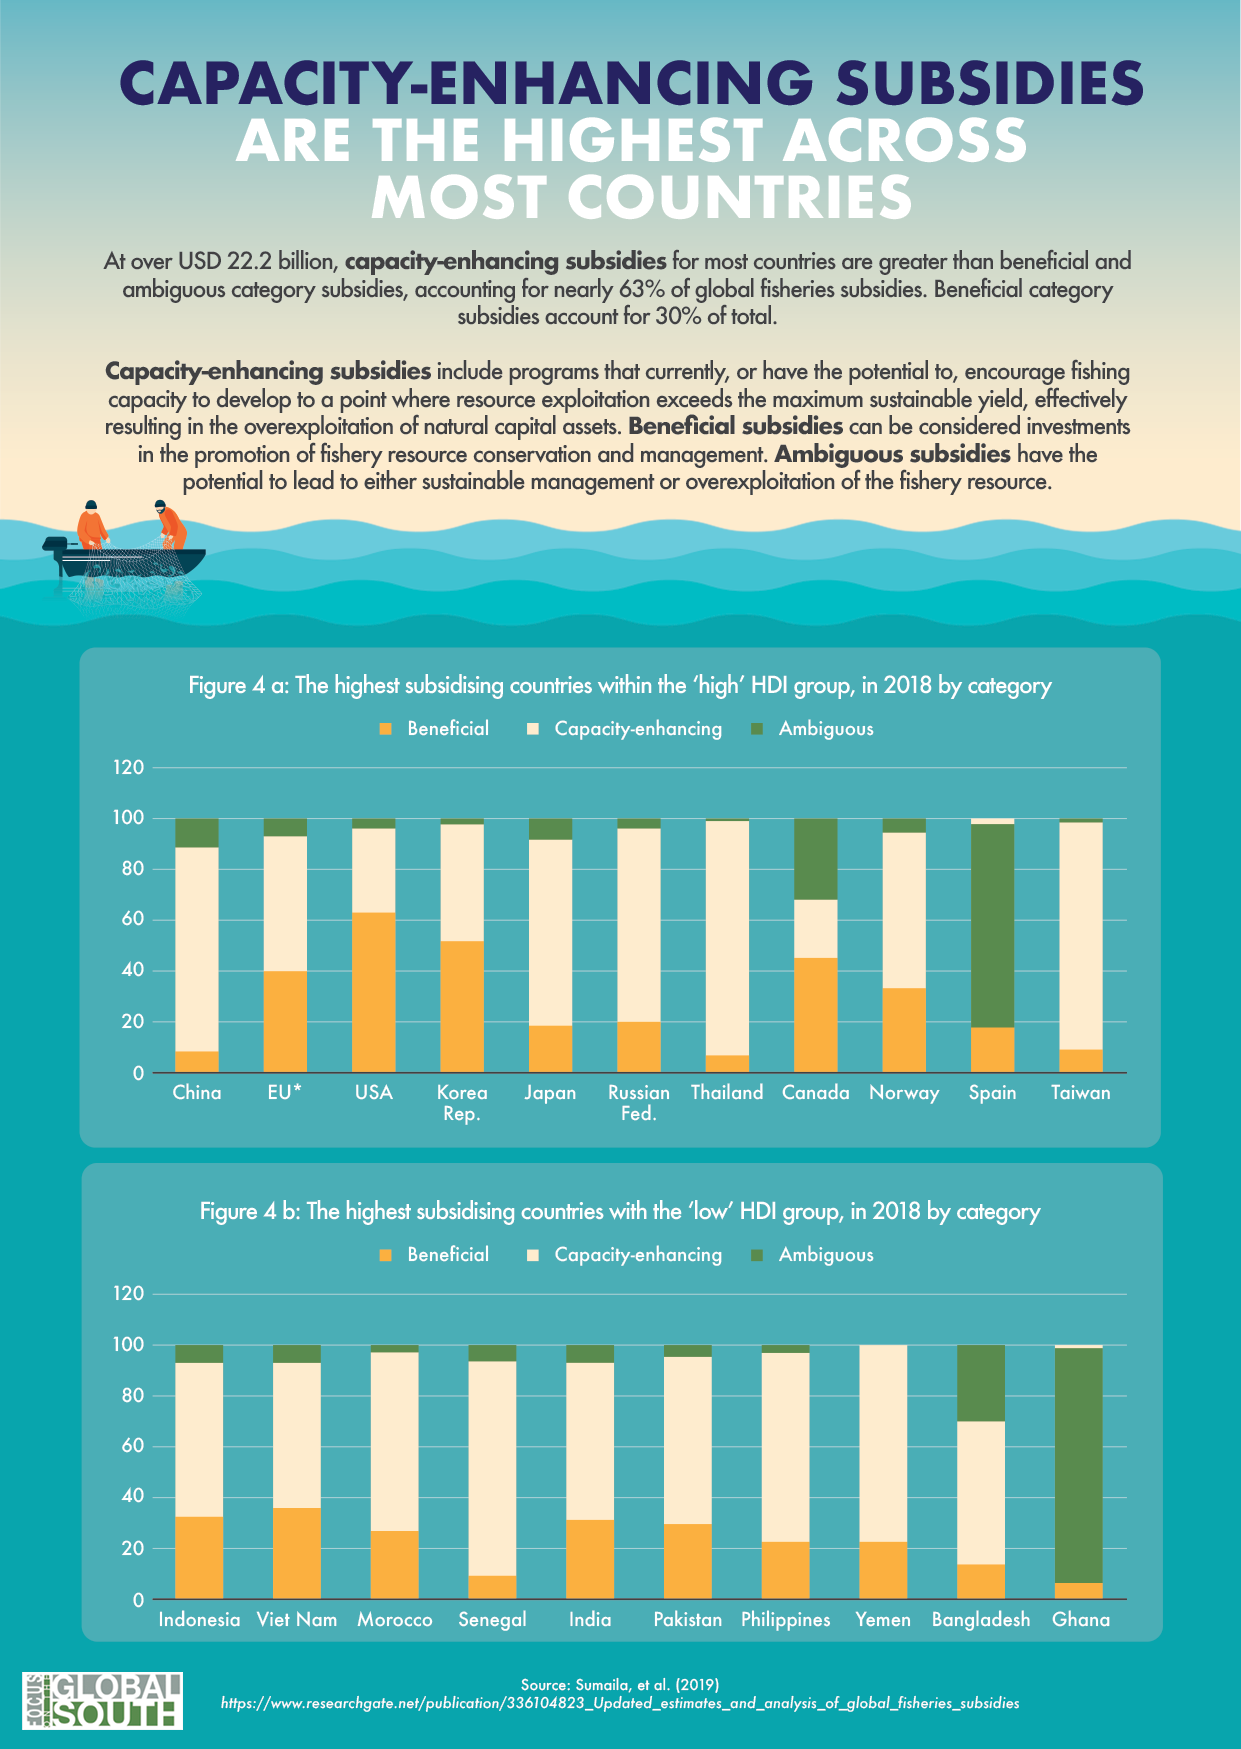
Infographic 4: Capacity-enhancing subsidies are the highest across most Countries
At over USD 22.2 billion, capacity-enhancing subsidies for most countries are greater than beneficial and ambiguous category subsidies, accounting for nearly 63% of global fisheries subsidies. Beneficial category subsidies account for 30% of total.
Capacity-enhancing subsidies include programs that currently, or have the potential to, encourage fishing capacity to develop to a point where resource exploitation exceeds the maximum sustainable yield, effectively resulting in the overexploitation of natural capital assets. Beneficial subsidies can be considered investments in the promotion of fishery resource conservation and management. Ambiguous subsidies have the potential to lead to either sustainable management or overexploitation of the fishery resource.
